In this blog post, we'll examine new turnkey capabilities to help you track key storage capacity consumption KPIs in real time.
At VAST, we pride ourselves in providing customers a single, unified all-flash platform where they can ingest and affordably store a tremendous amount of unstructured data. Oftentimes customers use VAST to consolidate multiple tiers of storage into a single namespace, which can allow them to scale capacity and performance as they see fit. Many of our customers start with just a few hundred TB of system capacity, and scale to 10s of PB’s in a single, all-flash namespace. Along the way, however, we’ve heard a request among customers:
“Show me what I have stored on the VAST filesystem”.
To dissect this a little, lets consider a few real-world use cases which were raised to us:
How do I know the Data Reduction ratio I am achieving per directory?
How much data is stored in /export/folder/sub/subsub/folder ?
If I delete /path/to/folder : how much Usable space will I reclaim?
What’s the average aTime of /scratch ? (so i can bother my users to delete stuff)
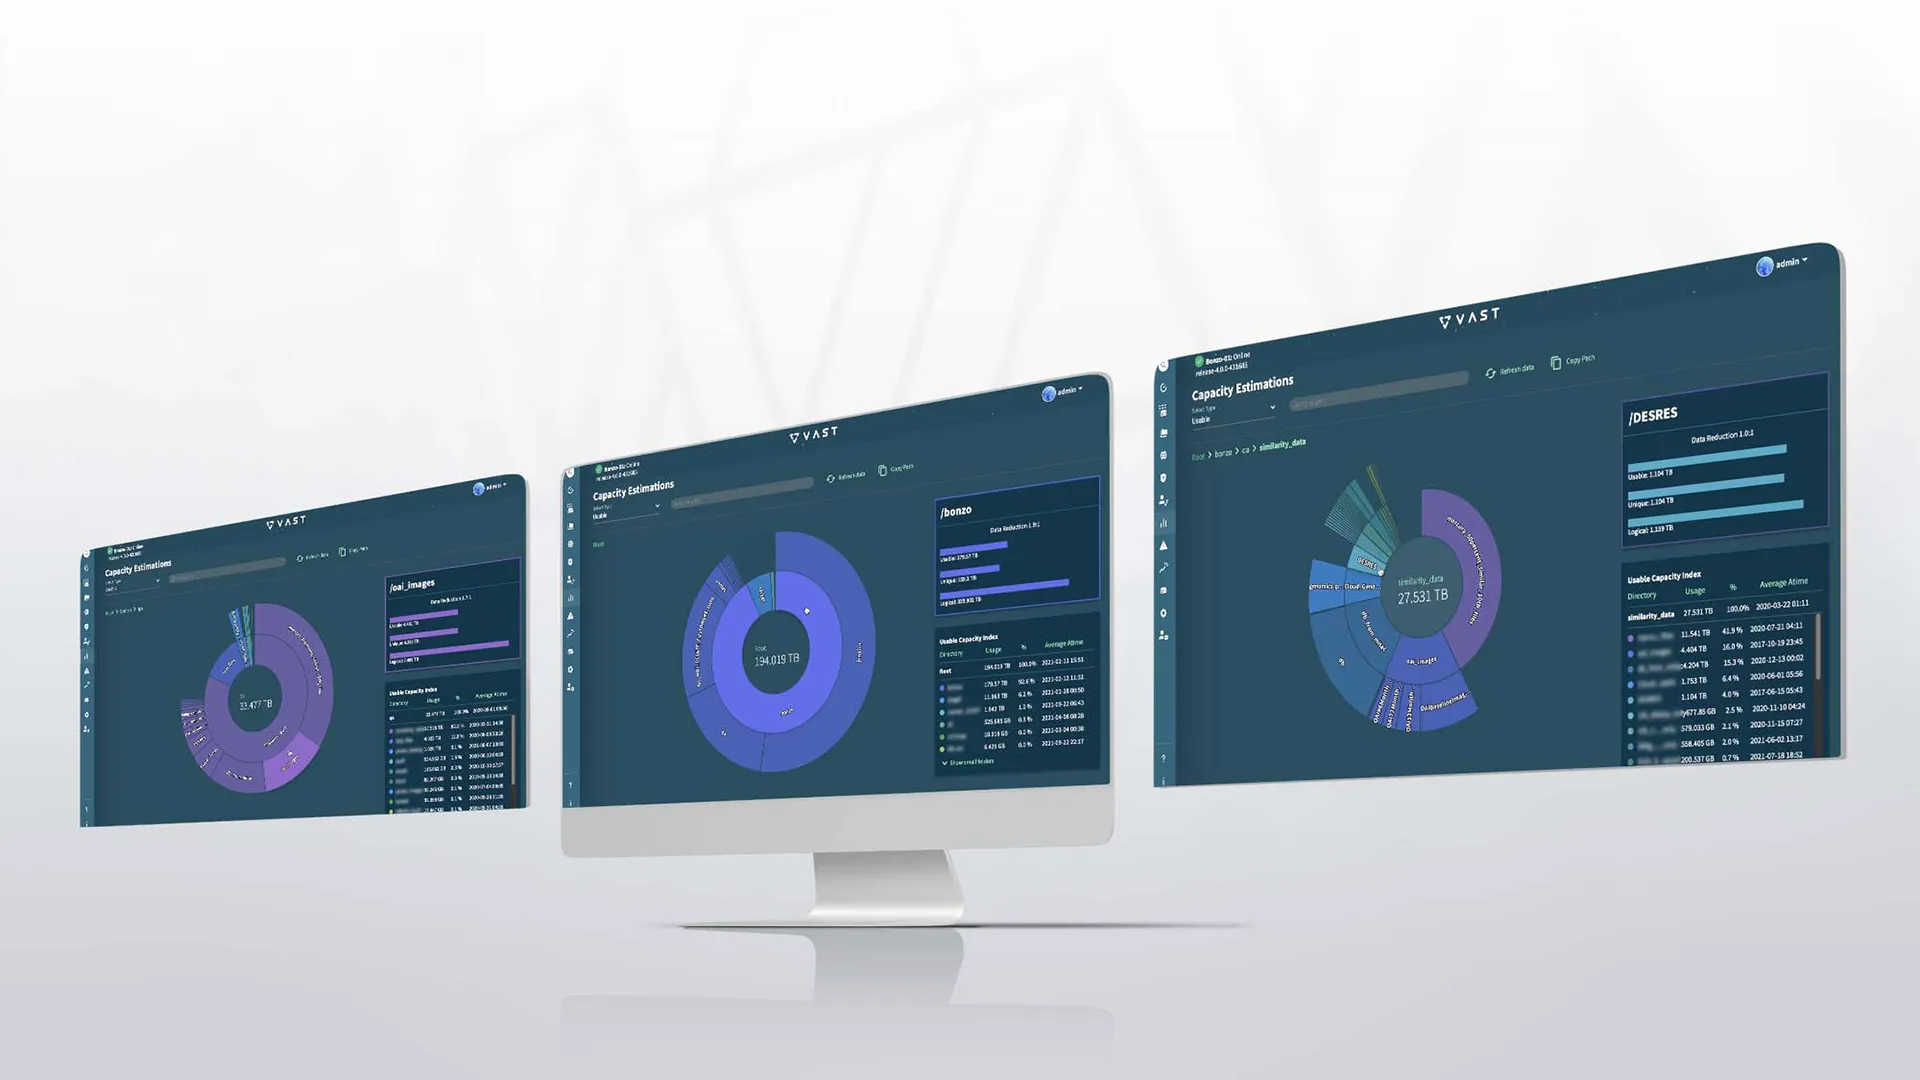
Obviously, there are 3rd party and open source tools which can provide this detail. However they can add cost and complexity. More importantly though, they require that the tool scan the entirety of the filesystem, which can be a lengthy process on systems with many millions or billions of files and objects. Also, such scans quickly become outdated as new data lands on the system, requiring re-scanning the file system on a regular basis. It would make far more sense for VAST to collect and display this data in an easy to consume way, without any additional administrative effort. In VAST-4.0, we introduce our Capacity Estimations feature. Like all new VAST releases, we prioritize features which directly solve real world customer needs, and increment functionality over time. Check out our new demo to see Capacity Estimation in Action.
A Glance into How It Works
To start with, let's talk about how we extract this data from the VAST Element Store. As you may already know, if you’ve read through the VAST White Paper, all data and metadata which is written to VAST will first land in Storage Class Memory (SCM), before being asynchronously migrated to low cost flash (QLC). This act of migration is known as a system Flow. During this Flow, we already:
Perform DataReduction using Dedup, Similarity Compression, and Standard compression
Build extremely wide, efficient stripes
Update metadata-pointers for migrated data within Storage Class Memory, in an atomic fashion
Turns out that this gives us the perfect engine for performing additional functions, such as scanning metadata so we can answer the capacity related questions above. As client activity flows through the system, we automatically sample the metadata for each and every directory, and embed the relevant aggregations into each Directory-Element’s extended metadata structure. This metadata is then available for query by VMS, allowing for administrators to get information on any directory within the filesystem quickly and easily.
Starting with VAST-4.0, we track the following for each and every directory;
Logical Bytes
Used Bytes
Unique Bytes
Average AccessTime (Atime)
Data Reduction Ratio (Derived per directory by dividing Logical by Usable)
Understanding VAST Capacity and Similarity-Based Data Reduction
To get more details on what we mean by Logical and Usable capacity, see Understanding VAST Capacity. Unique capacity, simply put, is the number of bytes which are unique to this directory. This is a necessary metric to track because of VAST’s always-on, inline DataReduction. For example, imagine you have two folders:
/virtualmachines/windows2012_template (10GB logical)
/virtualmachines/windows2016_template (12 GB logical)
Each of these folders contains a slightly different virtual machine template. Because there is similarity between these two folders, there is likely to be a measurable number of blocks which are duplicates. VAST DRR will automatically find these duplicates and only store one copy of each duplicate block. That’s great for space efficiency, but it can make it difficult to determine how much space would be reclaimed if an administrator were to delete the older template directory (2012). That’s where “Unique” bytes come into play. VAST samples the metadata for each folder, and identifies how many bytes do not have any duplicates elsewhere in the system. Therefore, Unique bytes will let administrators easily understand exactly how much Usable space can be freed once that directory is removed. In the case above, we might find that the 2012 directory has only 1GB of “Unique” bytes.
As with everything we expose in our UI, all of this information is available to query directly using our REST API, allowing administrators to inject these metrics into their own tools and dashboards. Currently, we are exposing only the real time Capacity Estimations metrics, but historical tracking is in the works, so stay tuned! In the meanwhile, checkout our blog post and demo to learn how VAST Data enables performance monitoring to quickly troubleshoot problematic workflows and optimize performance in real time.
To learn more about VAST Data, request a demo with one of our experts.


