Back in February our field CTO Andy Pernsteiner posted this product blog introducing the VAST Catalog. If you haven’t already, please check it out; there’s a must-see 5-minute video that will give you a rapid intro into what the Catalog is and the kinds of tasks it can be used for.
This entry is a follow-up that explores specific reporting scenarios using the VAST Catalog. VAST systems can get big: petabytes of data and billions of files and objects all housed in a single namespace. These types of large-scale systems traditionally have proven to be impossible to troubleshoot, manage and govern from a content perspective.
Not VAST. We already offered customers unparalleled visibility tools built into the UI for understanding data placement and storage utilization. Now we have the VAST Catalog, which takes things beyond visibility and into the realm of analytics.
In this blog we will solve a common reporting problem using nothing but SQL and the Catalog. Later this month, we’ll return with additional use cases.
Before We Begin
It is important to understand that the VAST Catalog resides in the VAST DataBase, a stand-alone data source for analytic and AI workloads. One interface to this database is Trino, an MPP data processing engine used for ad-hoc queries, business intelligence and big data analytics. Since it includes an integration with the VAST DataBase, we will use a small 1-node Trino instance for the SQL environment in these examples.
Trino Client invocation
The examples here are presented from an interactive Trino CLI session. Production reporting is usually done by interfacing an application with the Trino server using an API, like the Python module, JDBC driver or by simply using Trino’s REST interface directly.
That said, the CLI client can be used from shell scripts to execute queries and output reports (CSV_HEADER includes column names in output):

An interactive session can be started by simply downloading and running the Trino CLI Java binary on the same host as your Trino coordinator.
Now that the introductions are out of the way, let’s jump in and start writing some queries. We’re limiting ourselves to five reports that use different structures that might help you construct other even more interesting reports with the Catalog.
Report 1: Stale Data
We’ll start with an easy problem. We’ll include one easy solution and one more interesting approach.
Solution 1
Let’s pretend we’re managing storage at an HPC site that has a very simple data retention policy for cluster scratch space: Data that has not been accessed for 30 days (or more) needs to be purged from the system - after a 1 week notice period to the users. Data needs to be identified; users need to be notified; and then the data is to be removed.
This is a common data management practice that will prove impossible using a “find” on billions of files. It could take longer to execute than the notice period, but with the Catalog it’s quick and easy.
The first step is assessment. We build a report that will tell us how much “stale” data, both in terms of file counts and bytes, are consumed by each user. This way we can focus on the biggest offenders first.
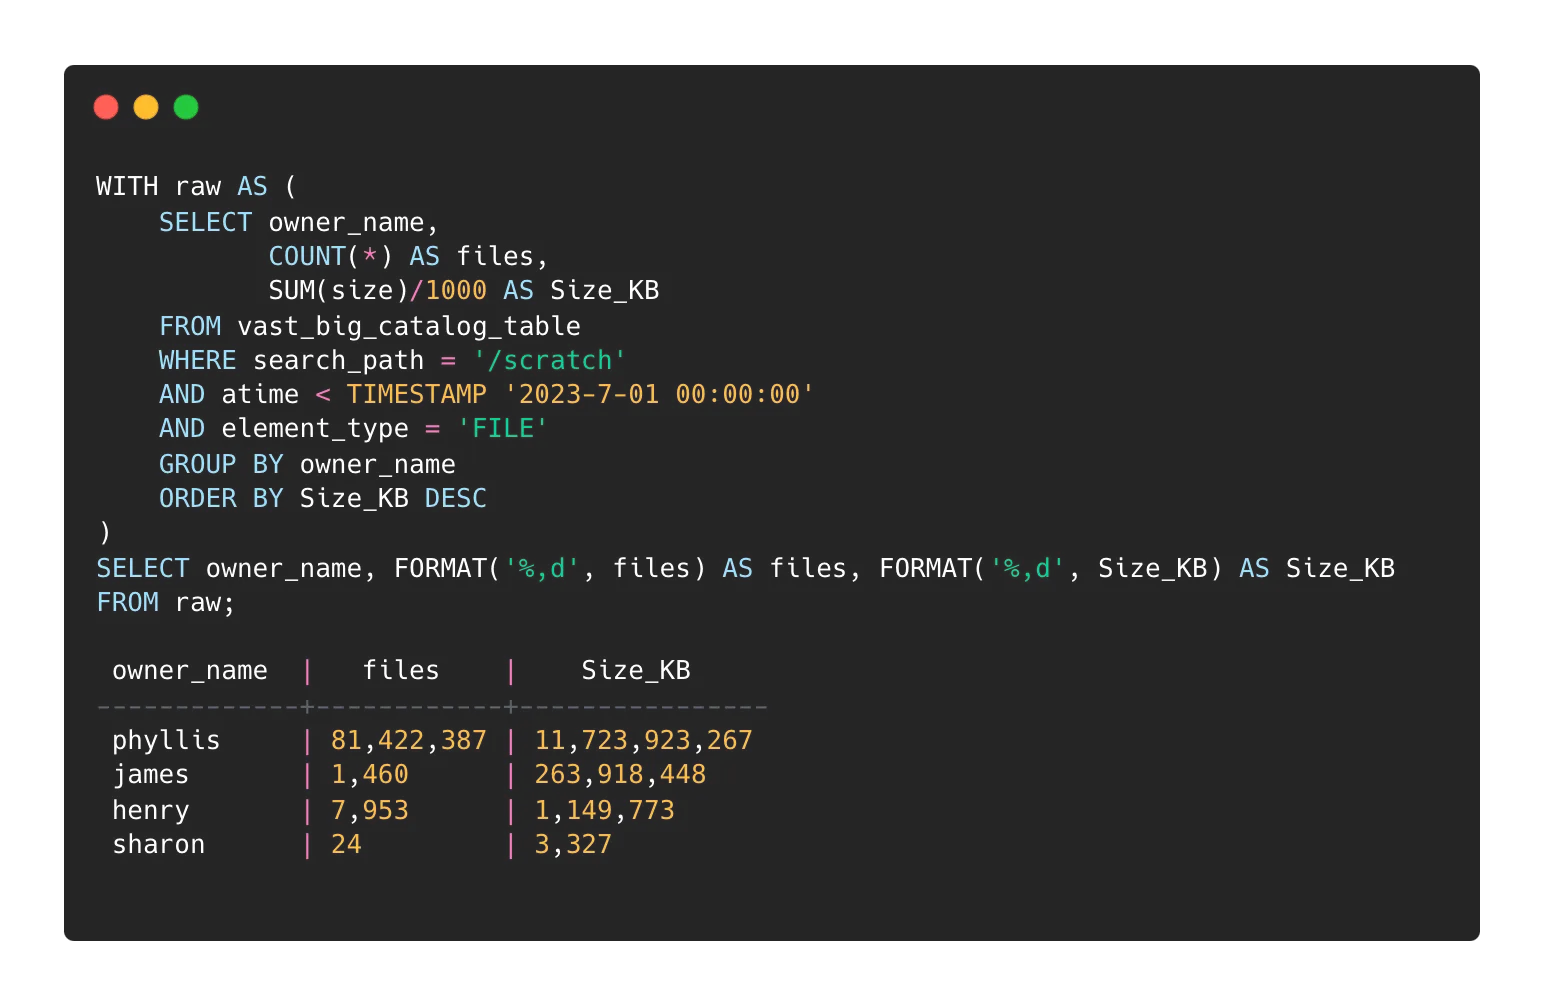
This query limits the search area to “/scratch” and returns a report on the number of elements and volume of data on a per user basis. We limit the element type to “FILE” since we don’t want to include directories (or any other element type supported by VAST).
The output shows us that there are 11 TB used by UID Phyllis that have not been accessed since the first second of 2023-7-01.
The second step is to generate the per-user file lists. These lists will be messaged to the individual users ahead of deletion. On a per user basis (‘phyllis’ in this example):
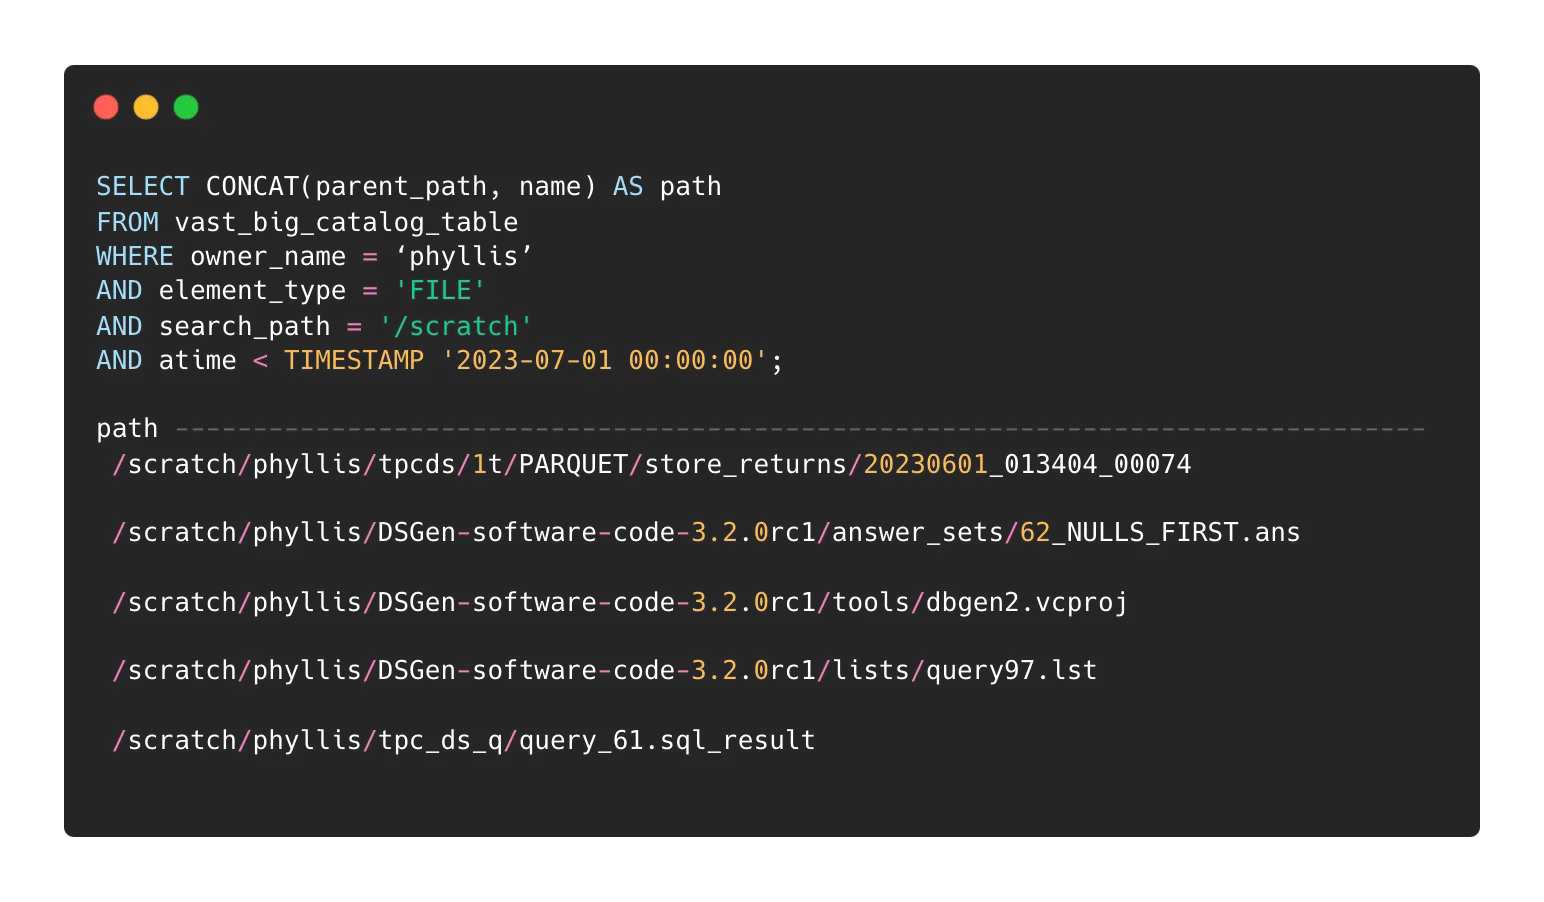
Once users are notified, the master list can be compiled by removing the owner_name filter from the above query.
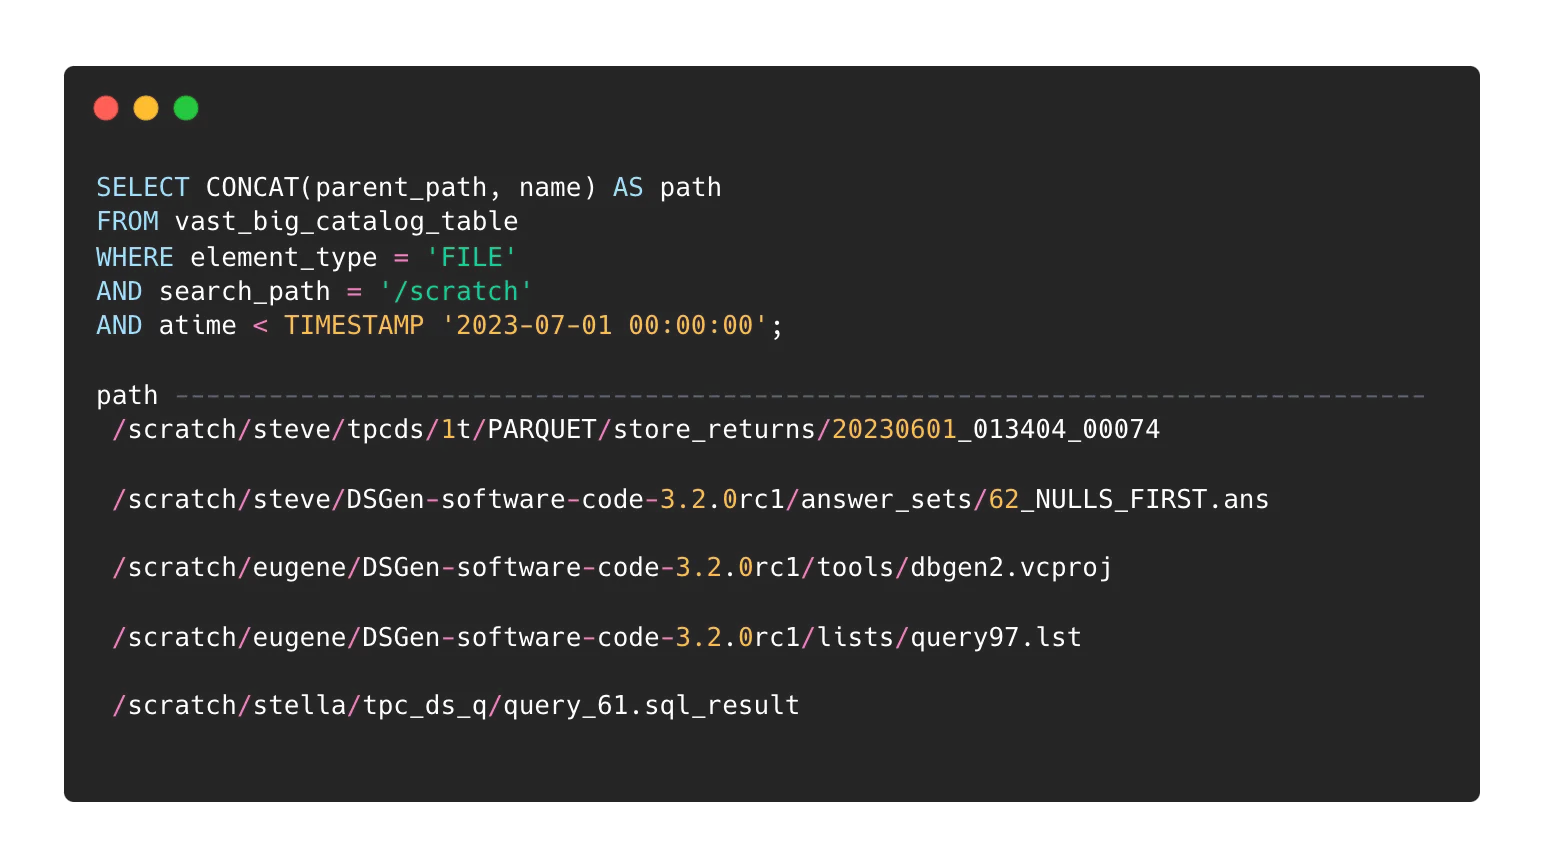
You may feed this list to a script for actual object removal (when the time comes).
Solution 2
This is way more fun. For a variation on the above report, site administrators can limit data removal in a load-following fashion. Rather than identify objects based on a hard time limit, a soft approach can be used where we discover only the oldest n-bytes of data. To limit the damage to this approach we will include an age limit to ensure that data no newer than a given date is affected. This example lists the oldest 10TB on the system.
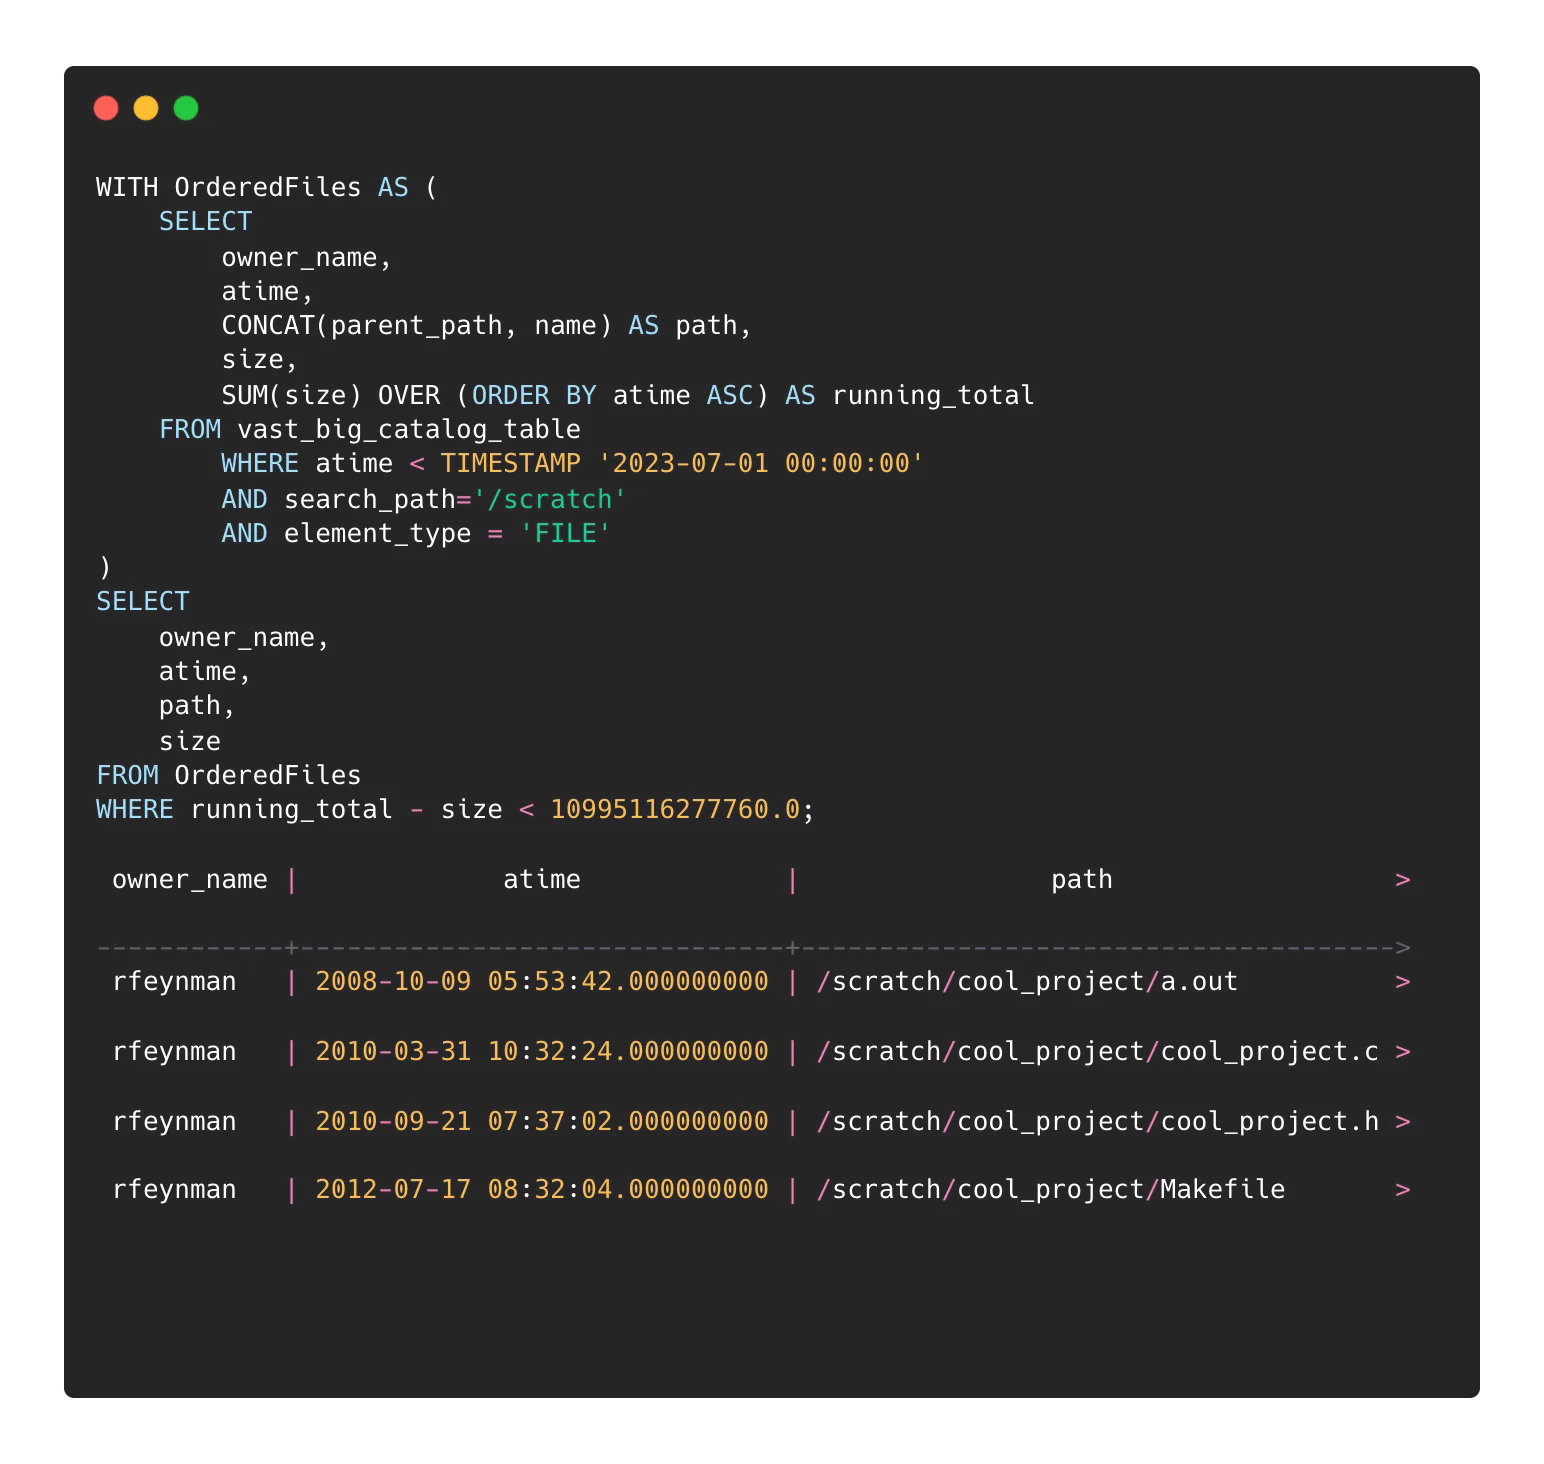
The above query will supply a master list of files to be flagged for removal.
You can add an aggregation calculation if you’d rather do this as a percentage of the targeted data rather than an exact amount. This example lists the oldest 20% of used data:
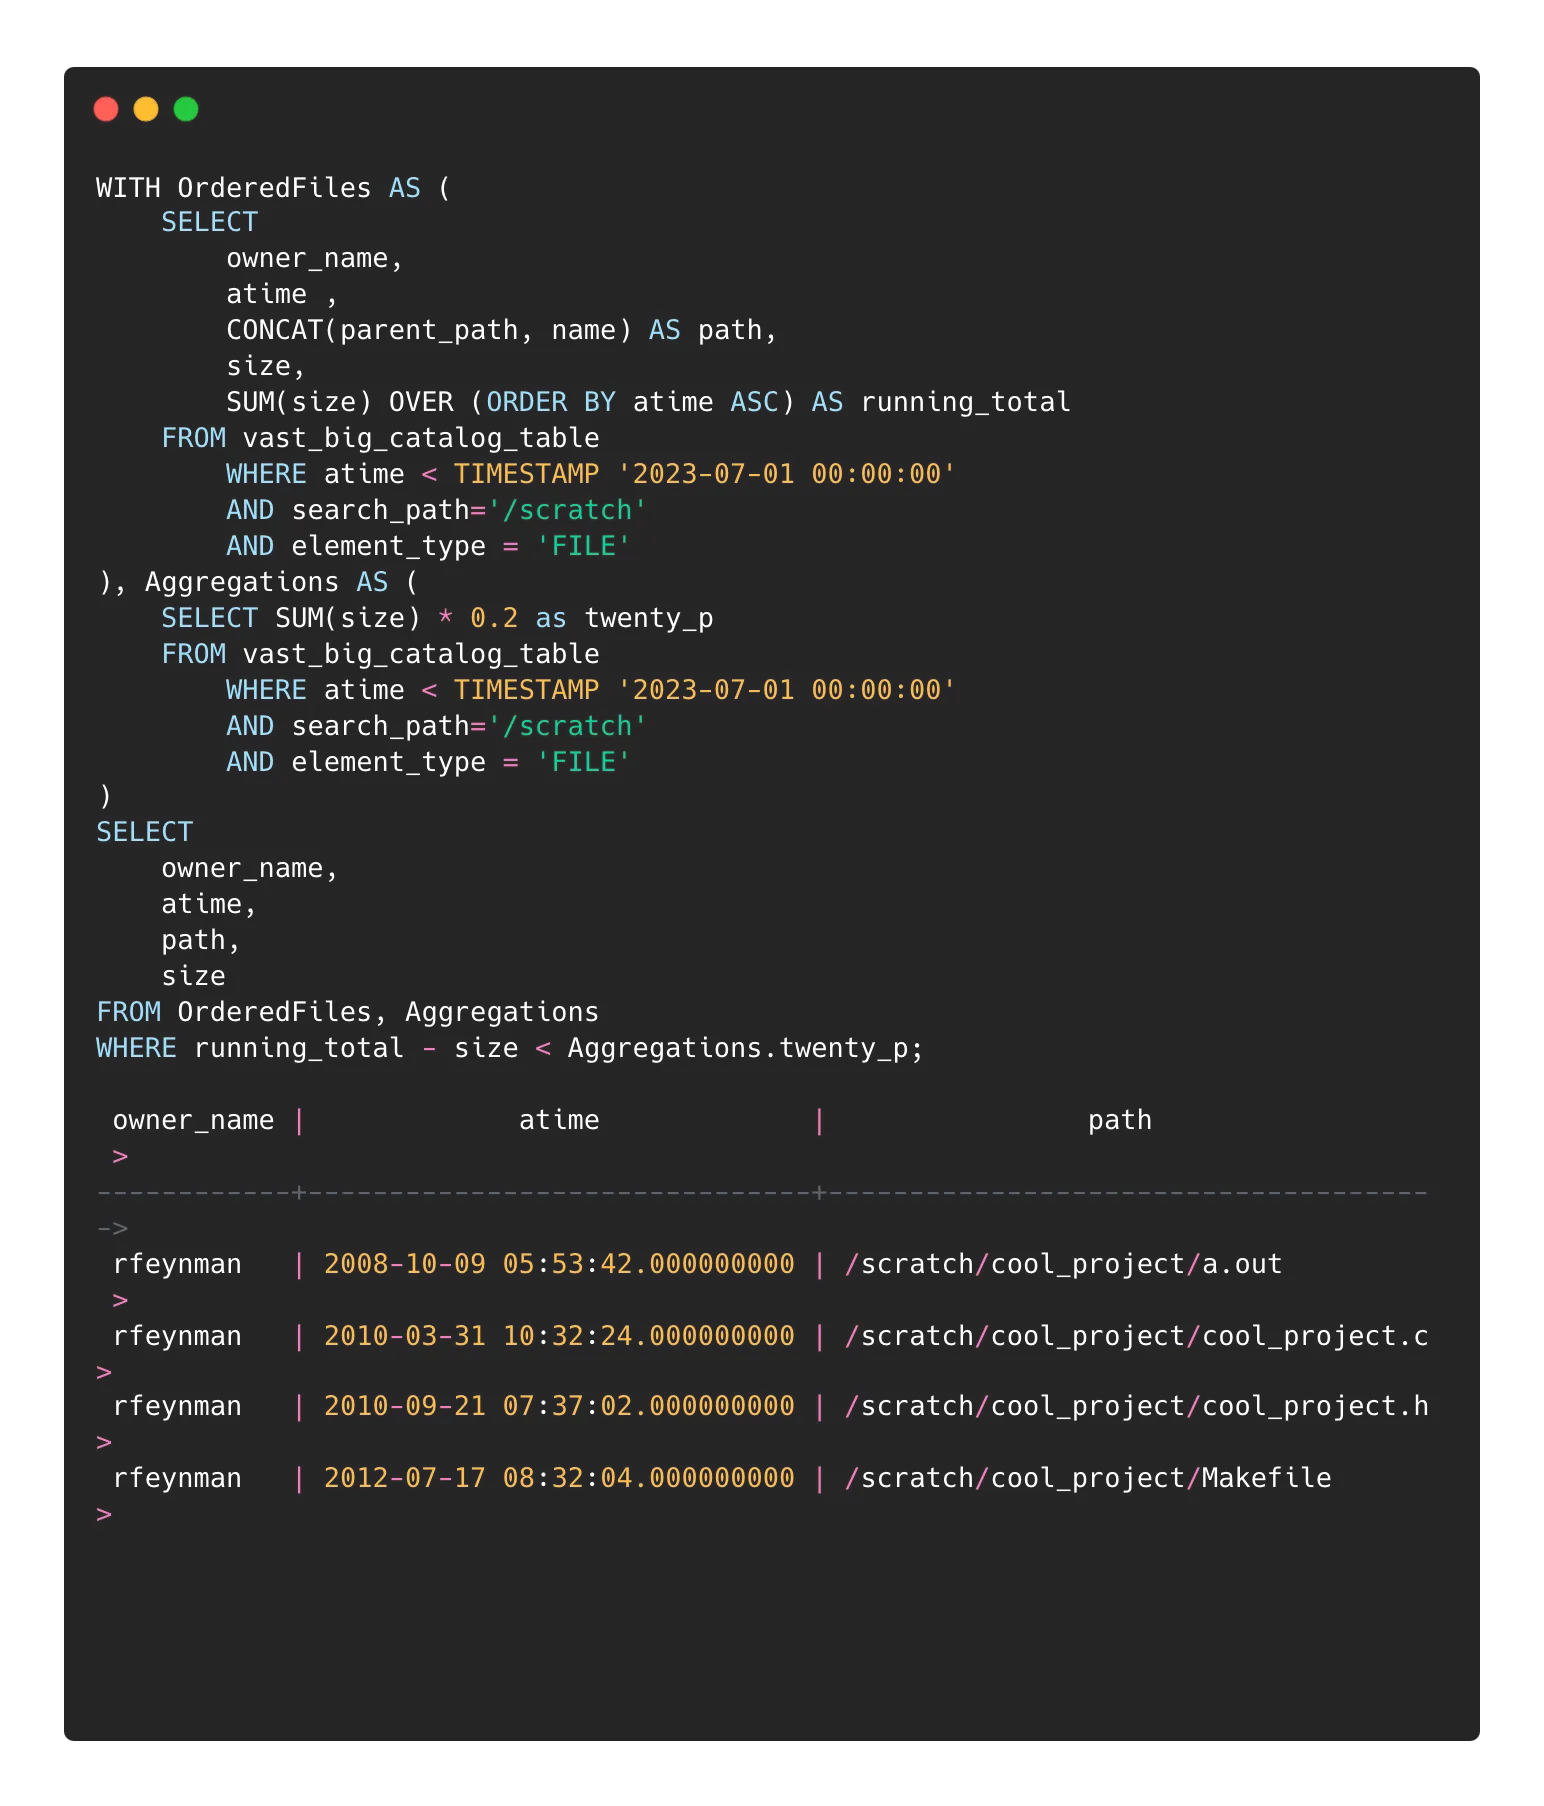
We can nest another query to generate a report showing the users and the amount of data potentially affected by the coming purge.
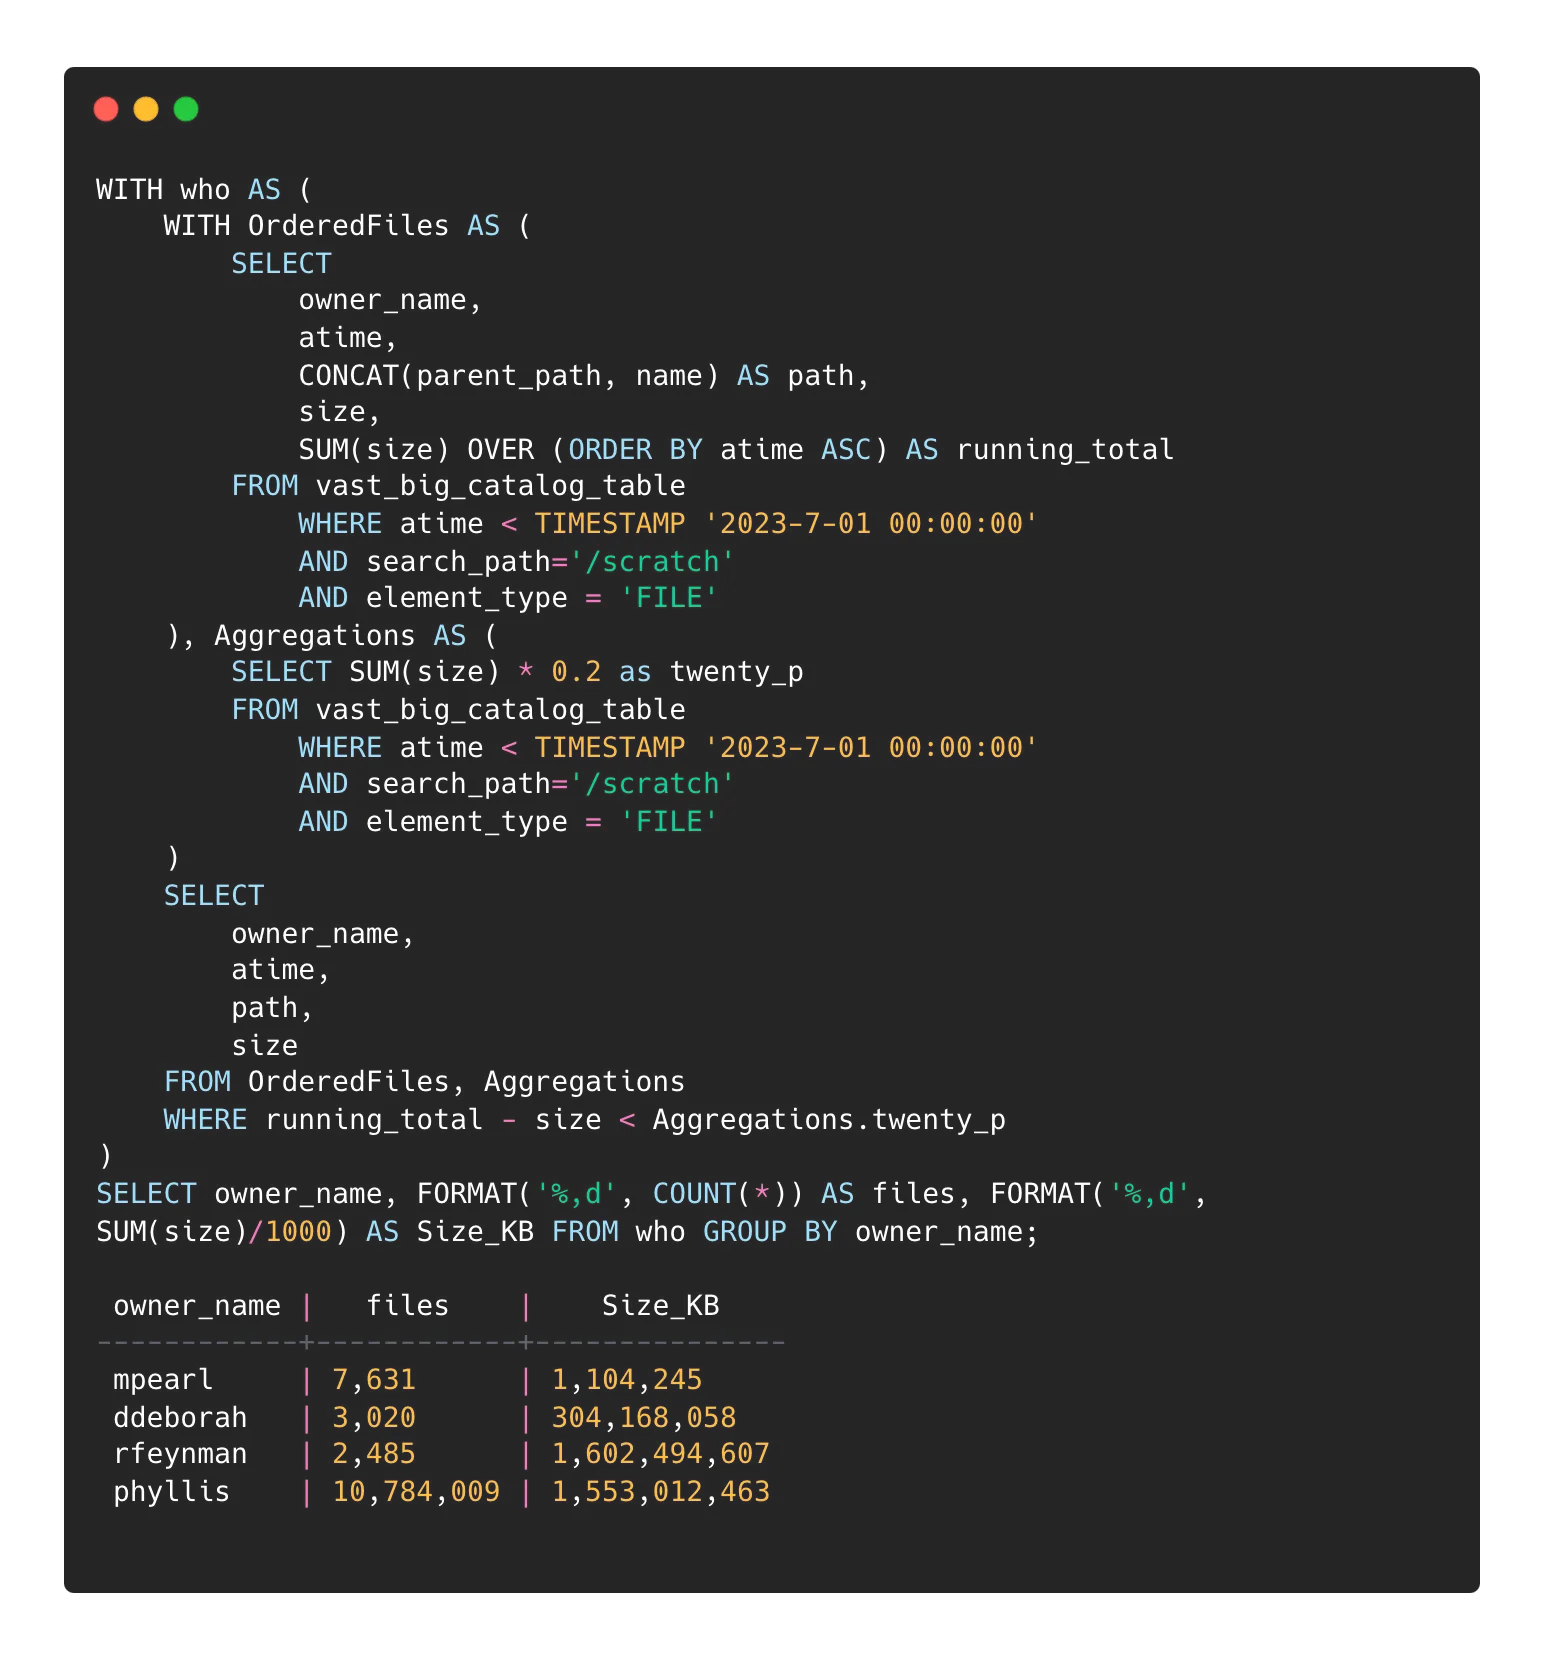
You can replace the last line of the above query to get the object lists for individual users:

A couple of notes on identifying old data using atime:
Files extracted from archives will retain the archived atime values. A recently extracted zip, for example, file would very likely contain files that are detected by these queries.
Atime update frequencies are set to 3600 seconds by default on VAST. This update frequency setting exists to avoid unnecessary metadata writes on read. If your queries are working inside of the atime update frequency, you could get unexpected results.
We’re just scratching the surface of the VAST Catalog capabilities. Next time I’ll dive into a few more use cases in which the Catalog streamlines common (and not so common) IT reporting scenarios. Stay tuned.
Read part two of Jason's blog here.


